Welcome to the November 2023 blog going over the data we collected from our local MLS on the last day of the previous month, or October 31, 2023. We take data for our target market which encompasses the cities of Miami Beach (South Beach, Mid Beach, North Beach), Surfside, Bal Harbour, Bay Harbor Islands and Fisher Island. We then break that data down into various data points that are helpful in looking for trends in the Real Estate Market to help with your decisions around buying or selling. You will notice some charts below, with an explanation underneath each chart:

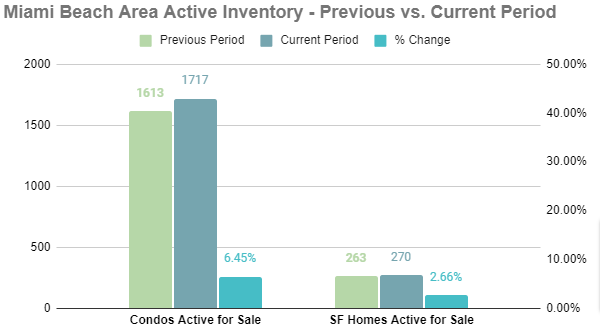
This is the supply side of the equation with active inventory for sale increasing for both condos by 104 units, and single family homes by 7 units.
We cannot stress enough that this supply side of the equation is critical to the fundamentals that drive pricing. And, market by market will have different abilities to remedy this supply issue, or not.
In our specific market, there is little to no land for new development, tough Historic preservation requirements, strict code requirements and zoning and planning constraints, expensive cost of construction and land acquisition, plus factor in the large amount of vacation home owners not desperate to sell or homeowners with 2-3% fixed rate mortgages with eroded purchasing power today...this all leads to the supply side issues this data point is highlighting and the media keep talking about.

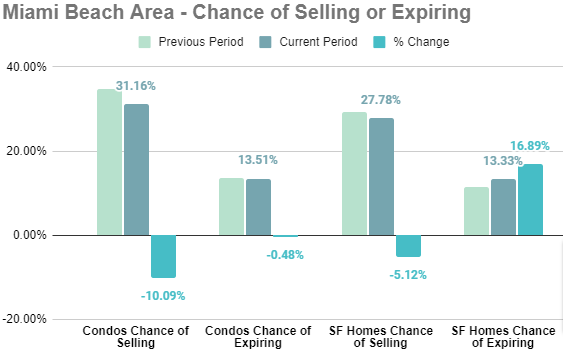
Looking at trends in the percentage of active inventory listed for sale that actually closes in the prior 90 days from 10/31/23 vs. the percentage of active inventory that expires unsold in the prior 90 days from 10/31/23.
We like this metric, and compare it to the previous months to look for trends. Not just trends of more or less closed sales or expired listings, rather put into context as a percentage of the actual amount of active inventory listed for sale in the market. That context is very important to understand any target market data analysis.
While the percent chance of a condo selling is still at a very high level of 31.16%, with inventory continuing to rise it will be important to see if total closed sales as a percentage continue to decline; both trends have been in place a few months now.
Just to put that number in context, the all time high was in May of 2022 at 126.30% and last month's reading was at 34.66%.
Our takeaway for Homes is a drop in the percent chance of a home selling from 29.28% to 27.78%. To put this in perspective, this hit a high of 107.89% in May 2021.
Laws of Supply and Demand are at play here, being it's very expensive to build anything new in the already built out barrier islands we are located on, with supply side constraints and continued demand, it seems market forces will continue to shape market values...
Please call anytime to talk market, it's one of our favorite things to do!

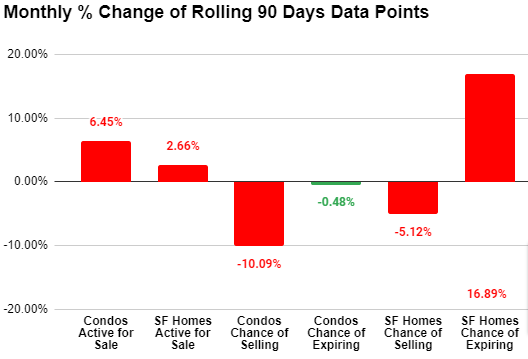
This chart expands on the previous chart and gives the actual percentage change from the prior month helping to understand how sharp of an increase or decrease and looking for any trends in this data point as well.

This is the data that we graph to show specific statistics. However, when taken in this format, it helps to see how the year has progressed, and shows longer term trend lines occurring throughout the year. This is for the data points Year to date, and can be helpful to compare month by month and overall changes over a longer period of time.
.png)
This is the data for Condos specifically broken down by price ranges.
.png)
This is the data for Single Family Homes broken down by price point.
The above 3 charts are not sent out in the newsletter, and is that actual data used to create the graphs. When you want to get more granular, these charts can be helpful to analyze.
Every month we send this Newsletter, it is not automated, nor is the data curated with the goal of creating any narrative. This is what we determine to be some of the most important data points when looking to buy or sell in this unique Real Estate Market. Please feel free to sign up for our newsletter here.


