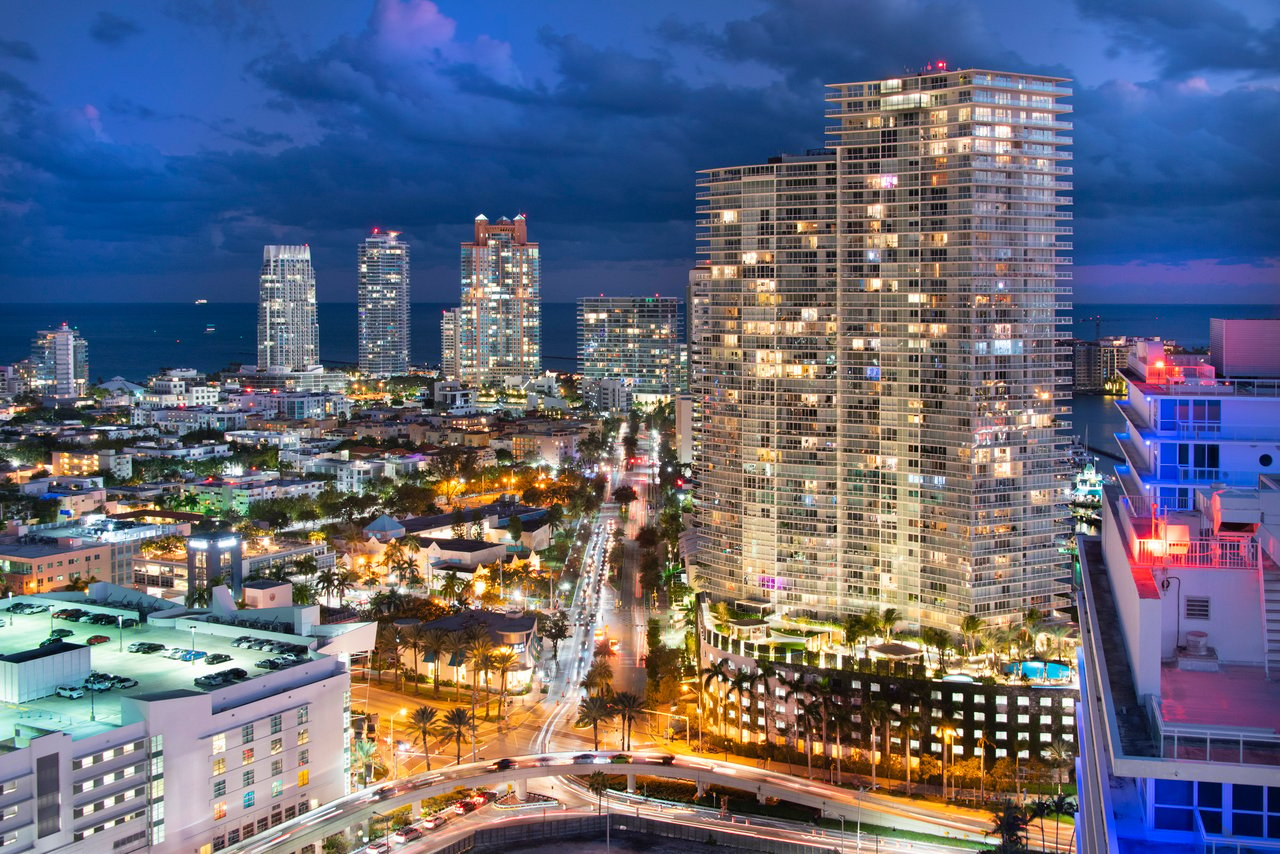
Miami Beach Real Estate Market Report: October 2026
Monthly Real Estate Market Report Sean Greco October 23, 2026
Monthly Real Estate Market Report Sean Greco October 23, 2026
Inventory up for two months straight. Closed sales down four consecutive months for condos, three for homes. If you stopped reading there, you'd think the Miami Beach luxury market was weakening. You'd be wrong.
After analyzing October 2026 data across Miami Beach, Surfside, Bal Harbour, Bay Harbor Islands, and Fisher Island, I've found something counterintuitive: this market is dramatically stronger than it appears. The key isn't what happened last month—it's what happened compared to last year.
This report breaks down the data through three critical lenses: month-over-month movement, year-over-year transformation, and seasonal context. For buyers and sellers navigating South Florida luxury real estate, understanding this distinction is essential.
Let's start with the numbers that grab attention. In October 2026, Miami Beach condo inventory climbed 6.3% to 2,051 units, marking the second consecutive month of increases. Closed sales dropped 24.5% to 447 condos sold—the fourth straight month of decline.
Single-family homes followed a similar pattern. Active listings rose 10.4% to 191 homes. Closed sales fell 37.8% to 69 homes, the third consecutive monthly decline.
But here's where the story gets interesting: expired listings collapsed. Condos saw a 17.6% decrease in expireds, dropping to 328 units from 398. Homes experienced a 10% decline, down to 27 from 30.
The practical implication shows up in the sell-versus-expire ratio. For condos, the likelihood of selling now stands at 21.8% versus a 16% chance of expiring unsold—a positive gap of 5.8%. For single-family homes, the advantage remains substantial: 36.1% probability of selling against 14.1% of expiring, maintaining a 22-percentage-point edge.
Despite rising inventory and falling sales, your property is more likely to sell than to sit unsold until your listing expires. That's not what you'd expect from a weakening market.
Here's what the month-over-month data doesn't tell you: October inventory increases and sales declines are what this market does every single year. Looking at seven years of historical data, condo inventory rose in six of seven Octobers. Closed sales for condos fell in six of seven. Home sales dropped in six of seven.
As we move from summer into fall, inventory naturally builds as sellers list properties, while transaction velocity slows through the holidays.
What is not seasonal—and this is the real story—is the expired listing collapse. The 17.59% October decline in condo expireds is the largest in the entire data series. The prior-year average for October expired movement is just -1.84%. This isn't a normal seasonal adjustment; it's a fundamental shift in market dynamics.
Equally telling: the sell-versus-expire gap usually narrows heading into October. In four of the last six years, that spread compressed as inventory built and sales slowed. This October, the gap widened from 4.52% to 5.8%. Properties became more likely to sell relative to expiring, even as seasonal headwinds picked up.
The honest framing: the inventory build and sales slowdown are calendar effects that happen almost every year. The collapse in expired listings is anti-seasonal and represents genuine market strength.
A year ago in October 2025, a Miami Beach condo was more likely to expire than to sell. The data ran 16.89% sell probability against 17.30% expire probability—a negative gap of 0.41 percentage points.
Fast forward to October 2026, and selling now leads by 5.80 percentage points. That's not a marginal improvement; it's a complete reversal. The fundamentals behind this shift: condo inventory is down 16.7% year-over-year, closed sales are up 7.5%, and expired listings have dropped 23%.
Single-family homes tell an even cleaner story. Inventory has fallen 22.4% compared to last October. Sales have climbed 11.3%. Expired listings have plummeted 35.7%. The sell-versus-expire gap stands at 21.99 percentage points today, compared to just 8.13 points last October. This is the best October performance for homes since 2021.
These year-over-year improvements reflect a market that has fundamentally rebalanced from the oversupplied conditions of 2025. For context, our May 2026 Miami Beach Market Report captured this transition as it was unfolding. Six months later, the trend has not only held but strengthened.
Geographic nuances add depth to the picture. Fisher Island's market dynamics continue to set the tone for ultra-luxury, while Bal Harbour and Surfside show their own distinct patterns within the broader improvement. Bay Harbor Islands offers a different value proposition, appealing to buyers seeking luxury at a slightly lower price point than oceanfront communities.
Months of supply provides the clearest snapshot of market balance. It answers a simple question: at the current sales pace, how long would it take to sell all active inventory?
For condos, months of supply stood at 17.8 in October 2025—deeply oversupplied territory that heavily favored buyers. By September 2026, it had compressed to 12.0 months. October 2026 came in at 13.8 months. Yes, supply loosened month-over-month as seasonal inventory built, but the market remains dramatically tighter than a year ago.
Single-family homes show even more pronounced improvement. October 2025 registered 11.9 months of supply. September 2026 tightened to 6.6 months. October 2026 sits at 8.3 months. Homes have moved inside the 6-9 month range generally considered balanced market territory, a remarkable recovery from last year's buyer-dominated conditions.
This compression in months of supply helps explain why expired listings have dropped so sharply. In an oversupplied market, properties sit. In a balanced or tightening market, properly priced properties move. The 23-35% year-over-year decline in expireds reflects this fundamental shift.
If you're considering listing a property in Miami Beach, Surfside, Bal Harbour, Bay Harbor Islands, or Fisher Island, the October data offers both caution and encouragement.
The caution: seasonal headwinds are real and normal. Inventory typically builds through October and November. Sales velocity typically slows. If you list now expecting June-level activity, you'll be disappointed.
The encouragement: your listing is 23-35% less likely to expire unsold than it was a year ago, depending on property type. The market has improved fundamentally. Buyers are active, financing is available, and properly priced properties are moving.
Pricing strategy matters more than ever. In an oversupplied market, you can overprice and hope. In a balanced market, overpricing means sitting while correctly priced comparables sell around you. The 5.8-percentage-point gap between selling and expiring for condos—and the 22-point gap for homes—exists for properties priced to market conditions.
The wildcard: if inventory continues rising while sales fall beyond normal seasonal patterns, pricing pressure could emerge in early 2027. Monitor the trend. Right now, the year-over-year strength outweighs the month-over-month seasonal softness.
For buyers, October 2026 presents a window of opportunity shaped by seasonal timing and year-over-year market evolution.
The immediate opportunity: more inventory and less competition. With 2,051 condos and 191 homes on the market—both up from last month—you have more options to evaluate. Transaction velocity has slowed, meaning you're competing with fewer buyers for any given property. Sellers listing in October and November are often motivated to close before year-end, creating potential negotiation leverage.
The strategic context: year-over-year improvements suggest this isn't a distressed market where sellers are desperate. Inventory is still down 16.7% for condos and 22.4% for homes compared to last October. The negotiation dynamic favors buyers relative to spring and summer, but it's not a fire sale.
The timing consideration: months of supply compression indicates the buyer-favorable window may be narrowing. Homes at 8.3 months of supply sit near balanced territory. If the market continues tightening into 2027, buyer leverage diminishes.
Property type matters. Single-family homes show tighter fundamentals than condos—8.3 months versus 13.8 months of supply. The 36.1% probability that a listed home will sell reflects strong demand. Condos offer more inventory cushion and potentially more negotiation room.
Geographic distinctions create different opportunity profiles. Fisher Island commands premium pricing with limited inventory. Bal Harbour and Surfside offer oceanfront luxury with slightly more availability. Bay Harbor Islands provides a value proposition for buyers seeking luxury finishes at a lower entry point than beachfront communities.
The October 2026 Miami Beach real estate market teaches a critical lesson: month-over-month data without context misleads. Inventory up and sales down sounds bearish until you recognize that October inventory rises and sales fall almost every year. Seasonality explains most short-term movement.
Year-over-year comparison reveals true market direction. Inventory down 16.7-22.4%. Sales up 7.5-11.3%. Expireds down 23-35%. Sell-versus-expire gaps that have flipped from negative to strongly positive. These are the numbers that matter for understanding market health.
The expired listing collapse is the signal, not the noise. A 17.59% October decline in condo expireds—against a historical average of just -1.84%—tells you something fundamental has changed. Properties are moving. The market has rebalanced from the oversupplied conditions of 2025.
I've spent 22 years analyzing South Florida luxury real estate, and I've learned that markets reward those who look deeper than headlines. Understanding these data points—what they mean in isolation, in comparison, and in context—is one of the smartest uses of your time.
If you'd like to discuss what these specific numbers mean for your situation—whether you're buying, selling, or simply staying informed—I'm here to help. The data tells the story, but your individual circumstances determine the strategy. Let's talk about how these market conditions create opportunities for you.
Here is the video summary of this same October 2026 Real Estate Market Report.

Stay up to date on the latest real estate trends.
Monthly Real Estate Market Report
Shows Surprising Strength Year-Over-Year - includes Surfside, Bal Harbour, Bay Harbor Islands and Fisher Island




SoFi Real Estate - Location, Location, Location - Miami Beach Real Estate Buyers

Whether you’re buying, selling, or investing, Properties &c. offers a personalized, concierge-style approach backed by deep local expertise. Let’s turn your real estate goals into a success story.