South Of Fifth Condo Market Trends Buyers Should Watch
March 24, 2026
March 24, 2026
Is South of Fifth still worth the premium in 2026, and how do you spot real value in a trophy market? If you are eyeing a SoFi condo, you want clear signals on pricing, inventory, and timing before you make a move. In this guide, you’ll learn how this pocket of South Beach behaves, what price-per-square-foot ranges to expect, and how to read building-level supply so you negotiate with confidence. Let’s dive in.
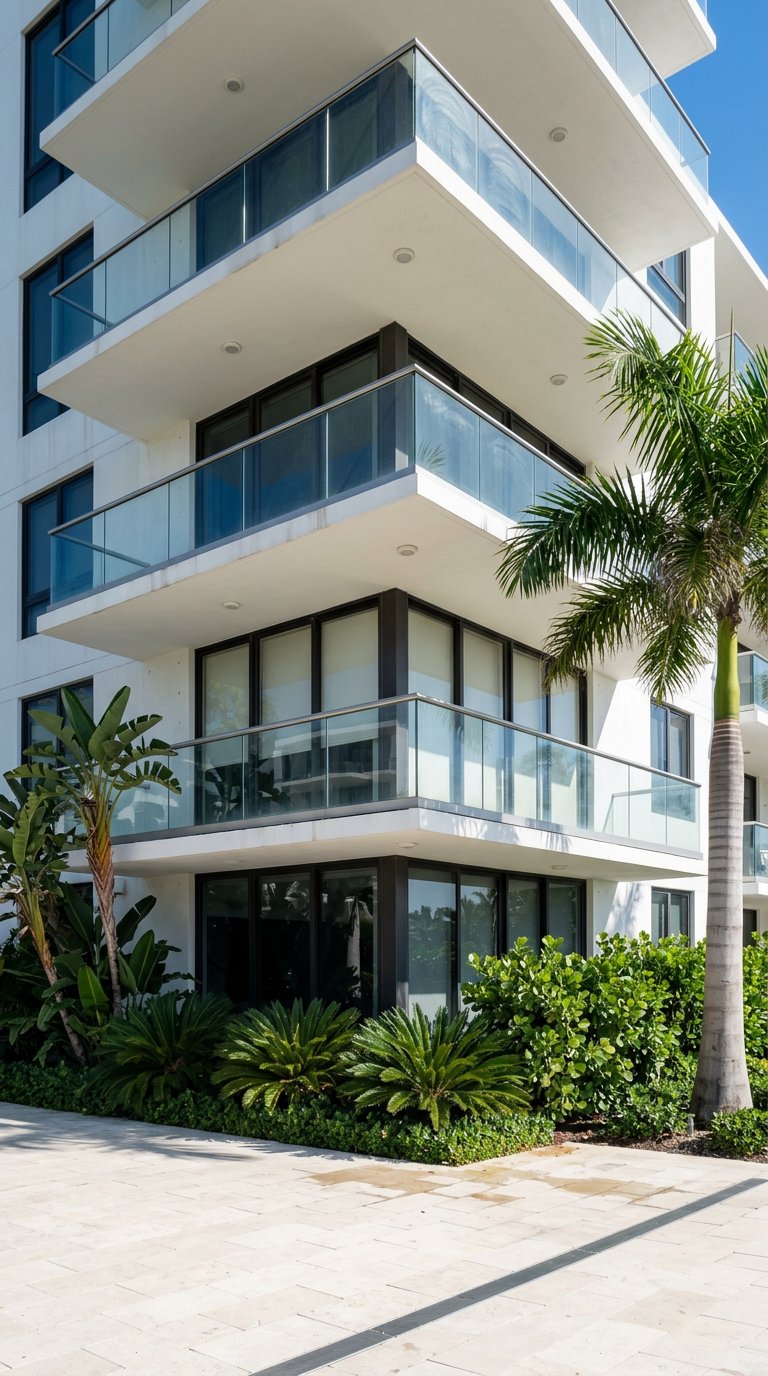
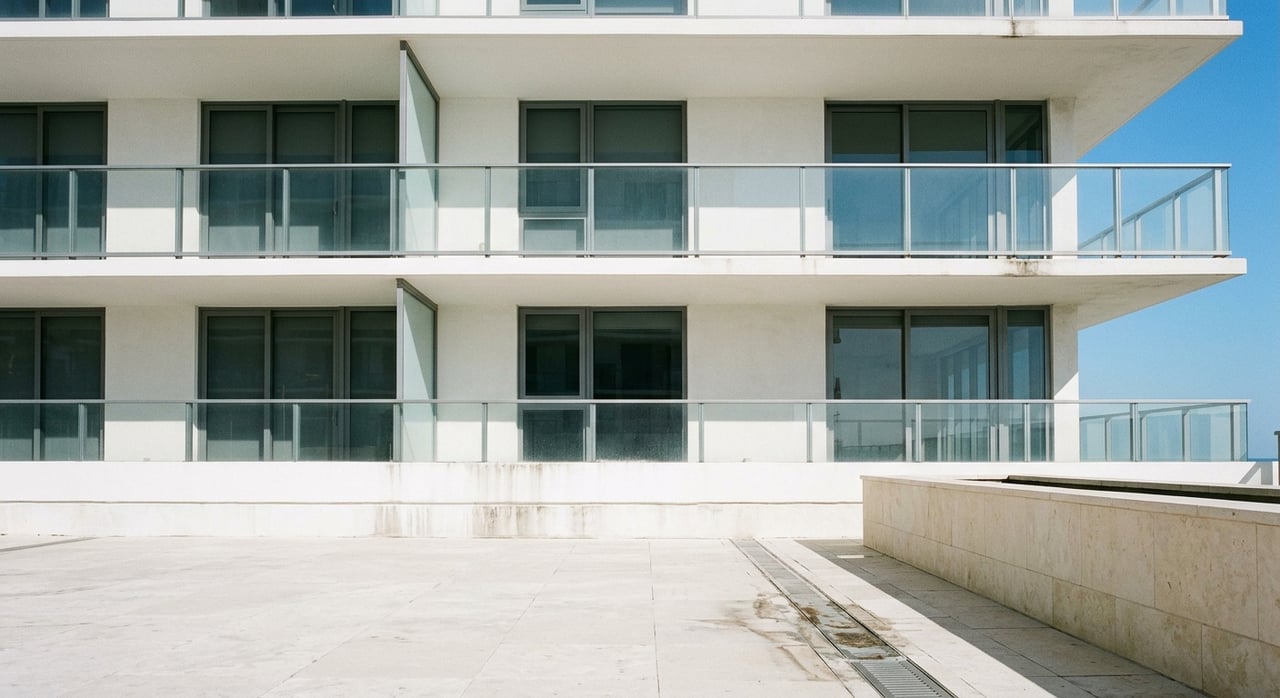
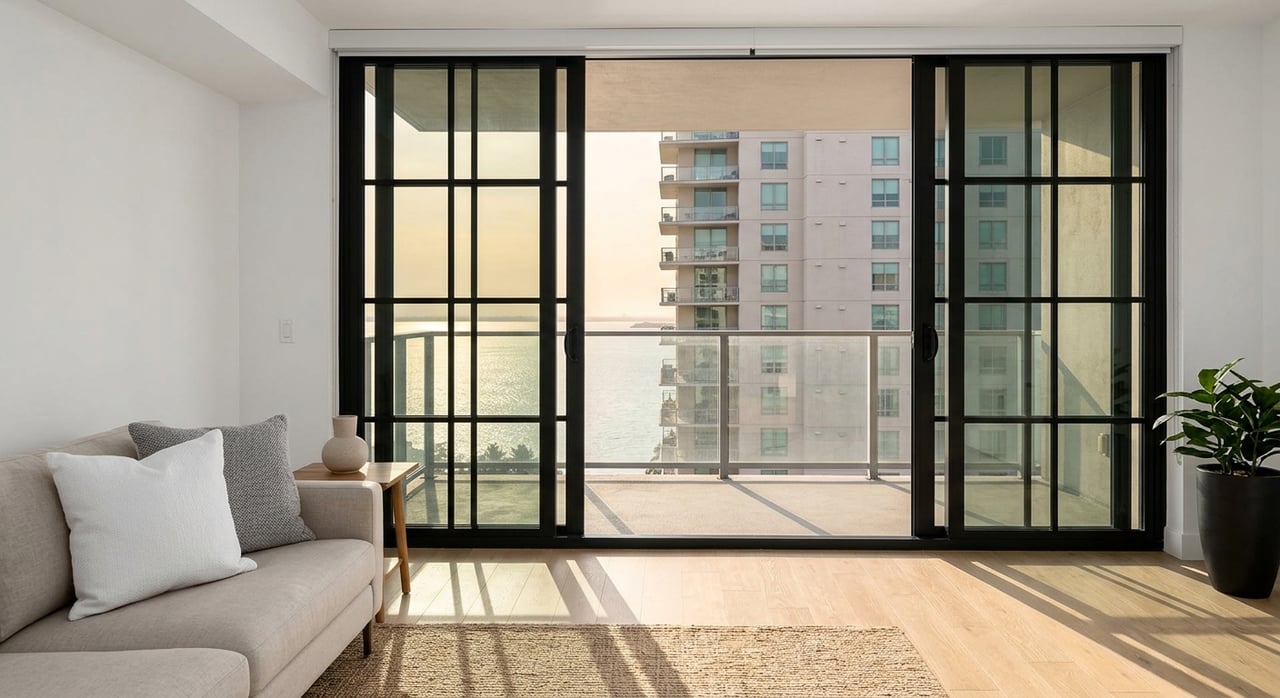
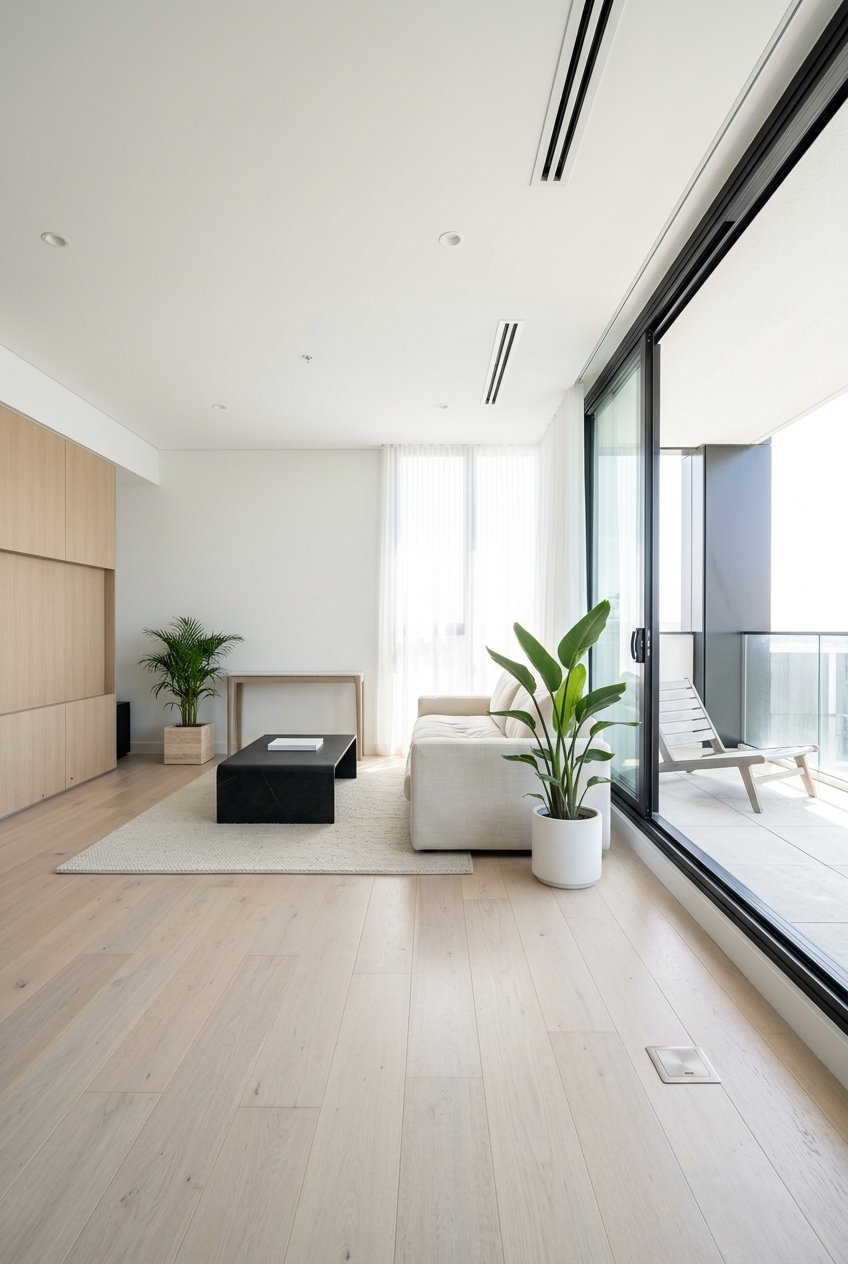
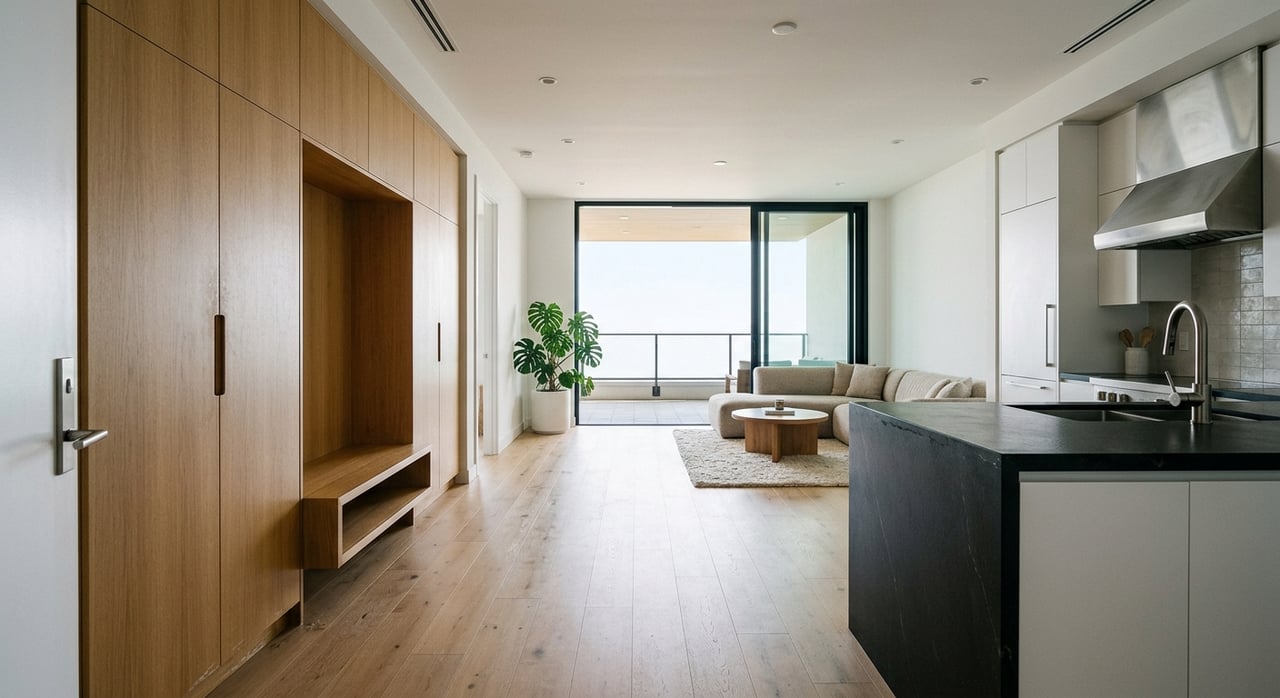
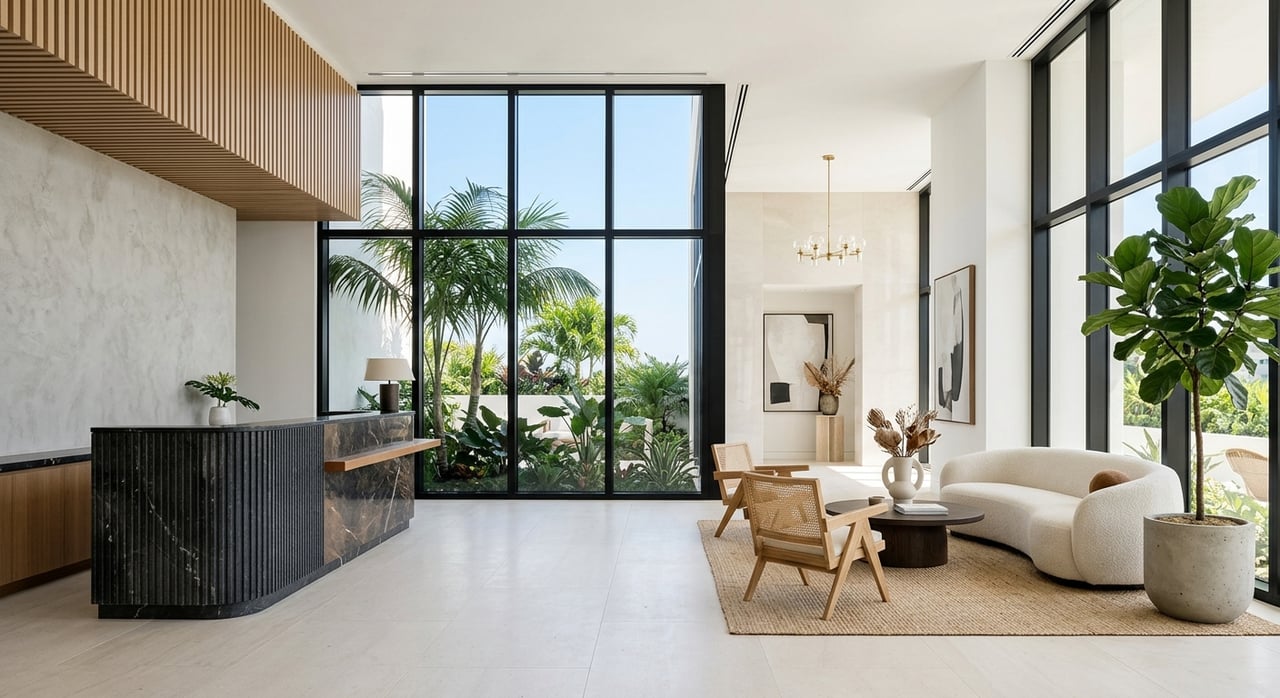
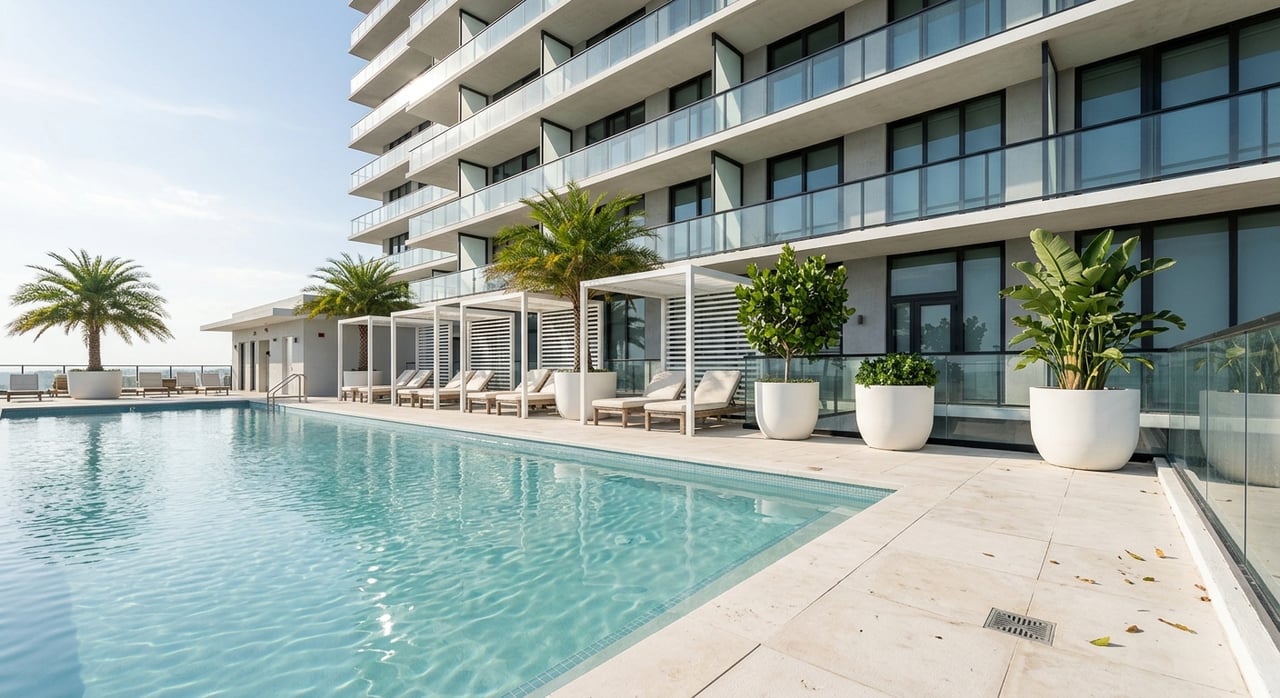
South of Fifth is a compact, waterfront district at the southern tip of South Beach, running north to 5th Street and bordered by the ocean and Biscayne Bay. It is defined by a tight set of full-service towers and a handful of boutique buildings with direct shoreline access and skyline views. You get a small, high-demand market where one closing can shift the averages.
For a quick primer on location and boundaries, review the district’s defined neighborhood overview. This context matters because SoFi’s small size means pricing and inventory move by building, not just by zip code.
At the county level, the condo market showed elevated supply in early 2026. According to the January 2026 MIAMI Association report, Miami-Dade had roughly 13.7 months of condo inventory, with median days to contract near 71 and median days to sale around 117. That reads as buyer-tilted for condos across the county.
SoFi is an exception in important ways. A high share of purchases are cash, especially in trophy towers. Transaction counts are also smaller, which means building-level supply and pricing can diverge from county-wide trends. Treat county numbers as background, then zero in on the building you want.
SoFi pricing is stratified by building, line, floor, and renovation level. A single neighborhood average can hide real differences. Use these ranges as directional anchors while you verify with a building-level CMA.
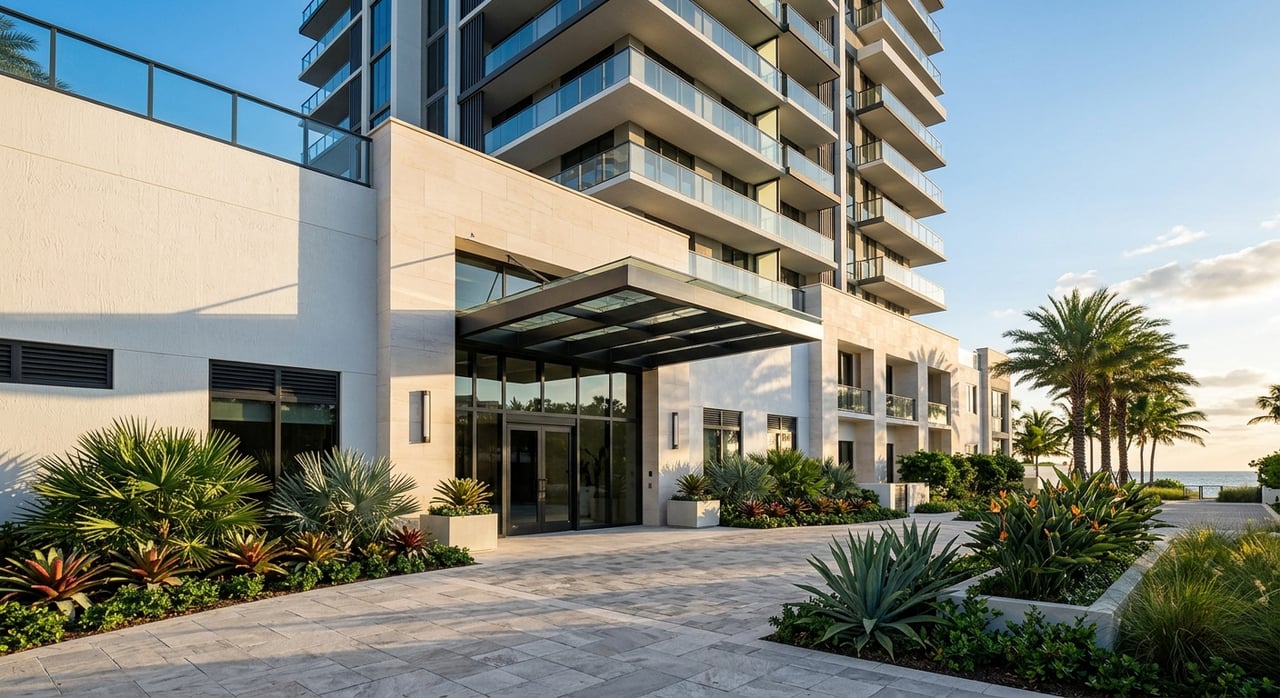
Buildings like Continuum (North and South), Apogee, 321 Ocean, Ocean House, and Glass define the ceiling. Recent trophy sales have shown price-per-square-foot in the mid $3,000s to $5,000+, with one-off penthouses even higher. Many closings are cash, and listing counts are often in the single digits at any moment.
Murano at Portofino, Murano Grande, Icon, and Portofino Tower sit in the upper-mid category. Recent deals in these buildings commonly land around $1,200 to $2,400 per square foot, depending on unit line, floor height, and renovation quality. These towers typically offer more active inventory and a bit more room to negotiate.
Older full-service and mid-rise options, including South Pointe Tower and select smaller buildings, can provide lower entry points into SoFi. Price-per-square-foot is influenced heavily by interior condition and views. Days on market can run longer for price-sensitive lines.
County data suggests buyers have leverage in condos overall, but SoFi’s micro-inventory is thin and can flip quickly. One month a building can show lean supply, then a wave of new listings or an ongoing renovation project can stretch months of inventory.
Days on market varies by product and price bracket. Larger combination residences and top-floor trophy lines sometimes sit longer due to a limited buyer pool. Smaller, more attainable lines tend to move faster when priced to the latest closed comps. Always confirm whether a days-on-market figure tracks days to contract or days to sale for an apples-to-apples comparison.
Use neighborhood stats as context, then make decisions at the building and unit-line level. Here is a practical checklist you can apply today:
Seasonality still shows up in Miami Beach. Winter brings more qualified buyers and deeper pockets, which can mean more competition. Shoulder seasons, like late spring and summer, often produce quieter windows where motivated sellers are open to the right terms. County figures also showed strength in higher price points early in 2026, per the January 2026 MIAMI Association report. Pair any timing strategy with a live MLS snapshot to confirm building-level supply.
To buy confidently in SoFi, match your offer strategy to building supply and recent comps.
If you are listing in SoFi, your best outcomes come from precision pricing and presentation.
Every SoFi building has its own rhythm. If you want a truly accurate read, request a custom market snapshot that includes active listings by building, recent closed sales, median $/SF by line, months supply, days to contract, cash share, and any known association items. We can also coordinate your entire plan end to end, from acquisition to financing to property management, so your transition is seamless.
Ready to see the real numbers for your target building? Call or text Sean Greco to get your live MLS/CMA and a clear strategy for your goals.
Stay up to date on the latest real estate trends.
SoFi Real Estate - Location, Location, Location - Miami Beach Real Estate Buyers
Whether you’re buying, selling, or investing, Properties &c. offers a personalized, concierge-style approach backed by deep local expertise. Let’s turn your real estate goals into a success story.